
Long-Term Divergences Cause Significant Bitcoin Dominance Rate (BTCD) Increase
The bitcoin dominance rate (BTCD) is very close to a crucial resistance level, a breakout above which would indicate that the long-term downward movement has ended.
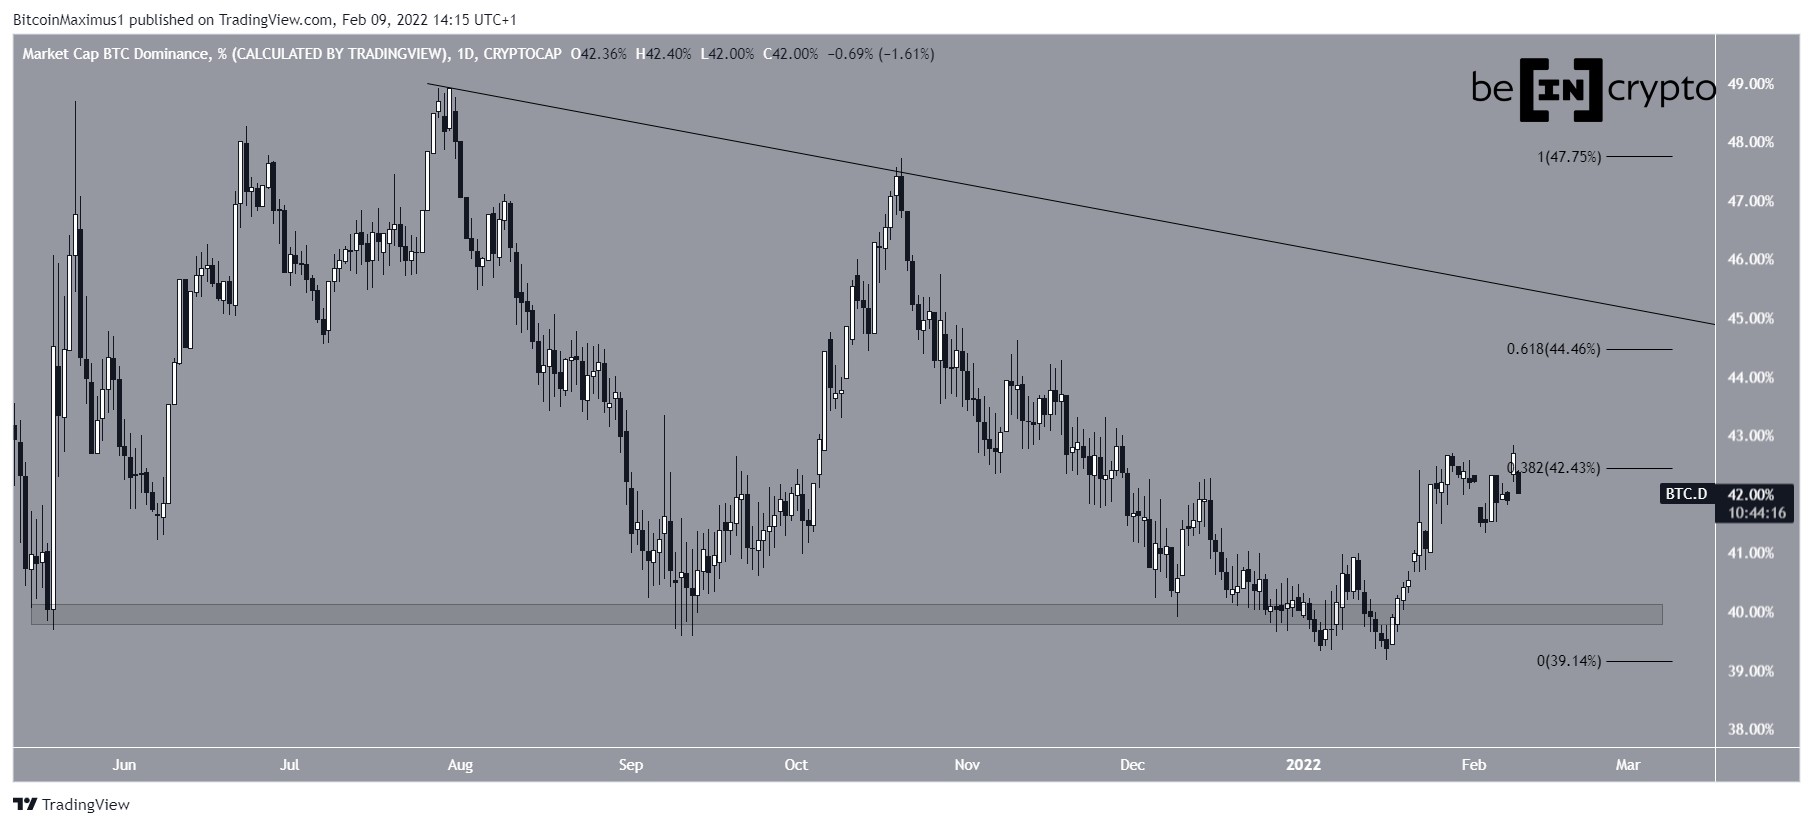
BTCD has been moving upwards since Jan 16, when it fell to a low of 39.25%. At the time, it had just broken down from the 39.50% horizontal area. However, it has reclaimed the area since and proceeded to reach a high of 42.83% on Feb. 8.
Afterwards, BTCD was rejected by the 0.382 Fib retracement resistance level, which is located at 42.5%. If it is successful in moving above it, there would be strong resistance at 44.5%. This is the 0.618 Fib retracement resistance level and coincides with a descending resistance line.
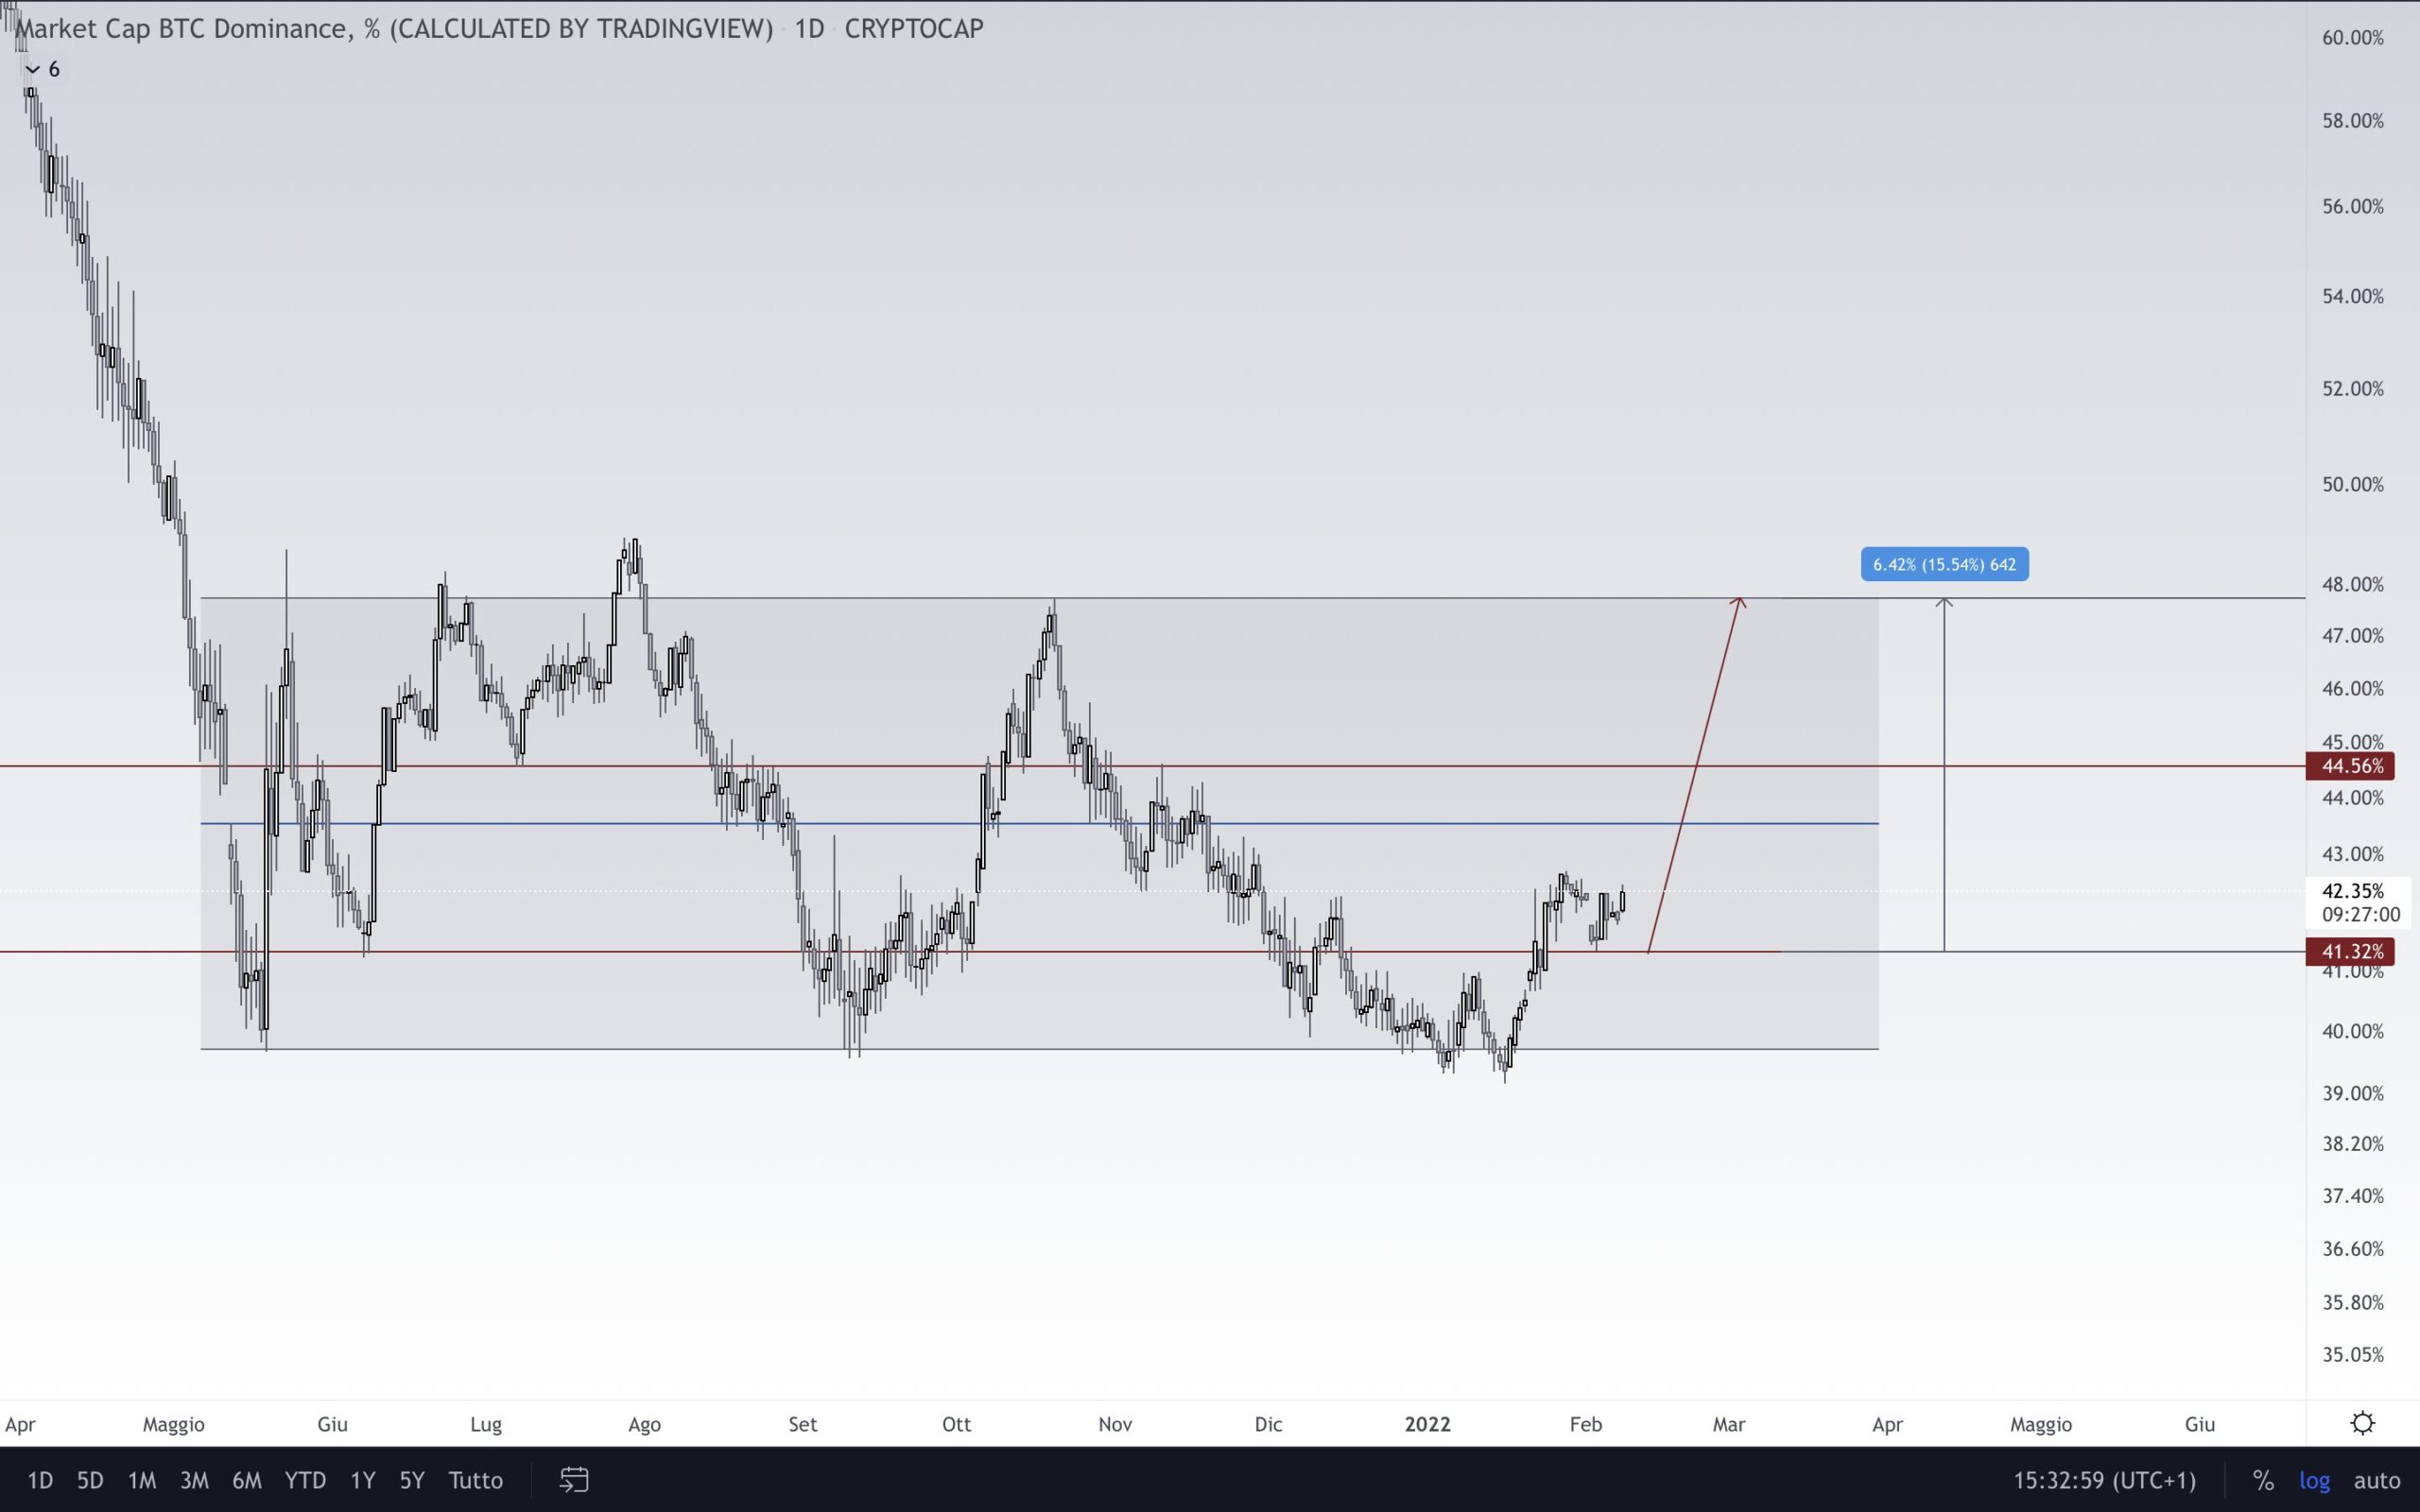
Cryptocurrency trader @eliz883 tweeted a chart of BTCD, stating that an increase towards 48% is likely.
Due to the considerable overhead resistance, a closer look at technical indicators is required in order to determine if BTCD will get there.
Technical indicator readings
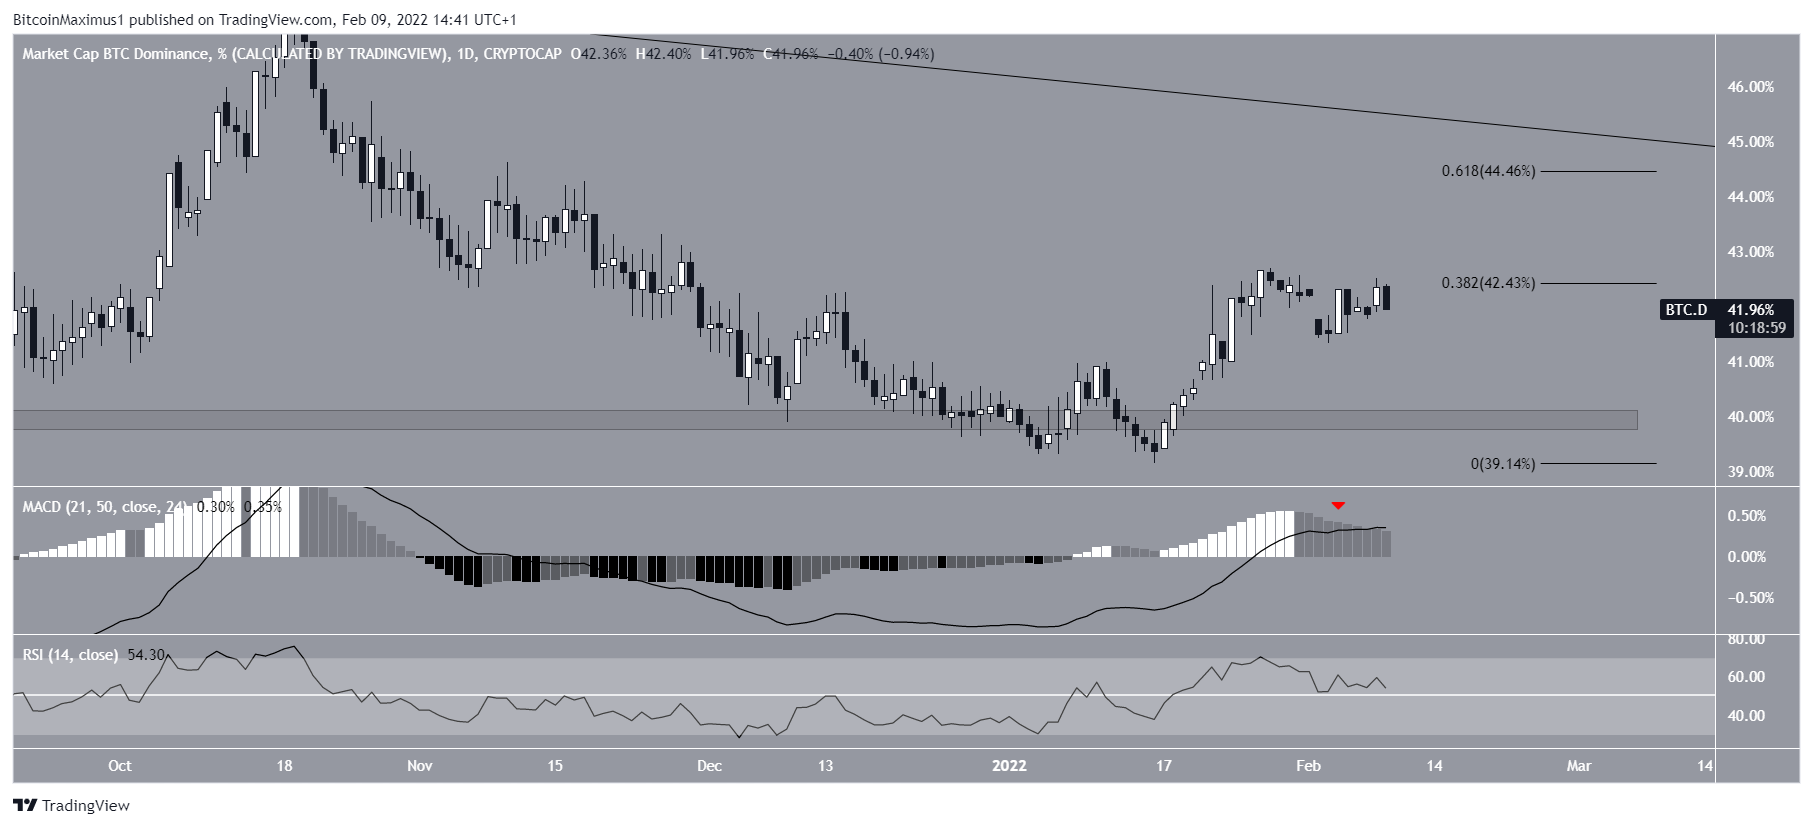
In the daily time-frame, both the MACD and RSI are showing signs of weakness.
The MACD, which is created by a short- and a long-term moving average (MA) is decreasing. This means that the short-term MA is decelerating relative to the long-term one and is a sign of weakness.
Similarly, the RSI, which is a momentum indicator, is also falling. While the fact that it is above 50 is bullish, the decrease is also seen as a sign of weakness.
Long-term BTCD movement
An interesting development is the fact that the increase since Jan 4 resembles a five wave upward movement.
IF correct, then BTCD is in wave four of this increase.
The most likely target for the top of the upward movement would be near 43.4%. The target is found using the 1.61 external Fib retracement on sub-wave four (black) and the 0.618 length of waves 1-3 (white). The target is also close to the previously outlined 44.5% resistance area.
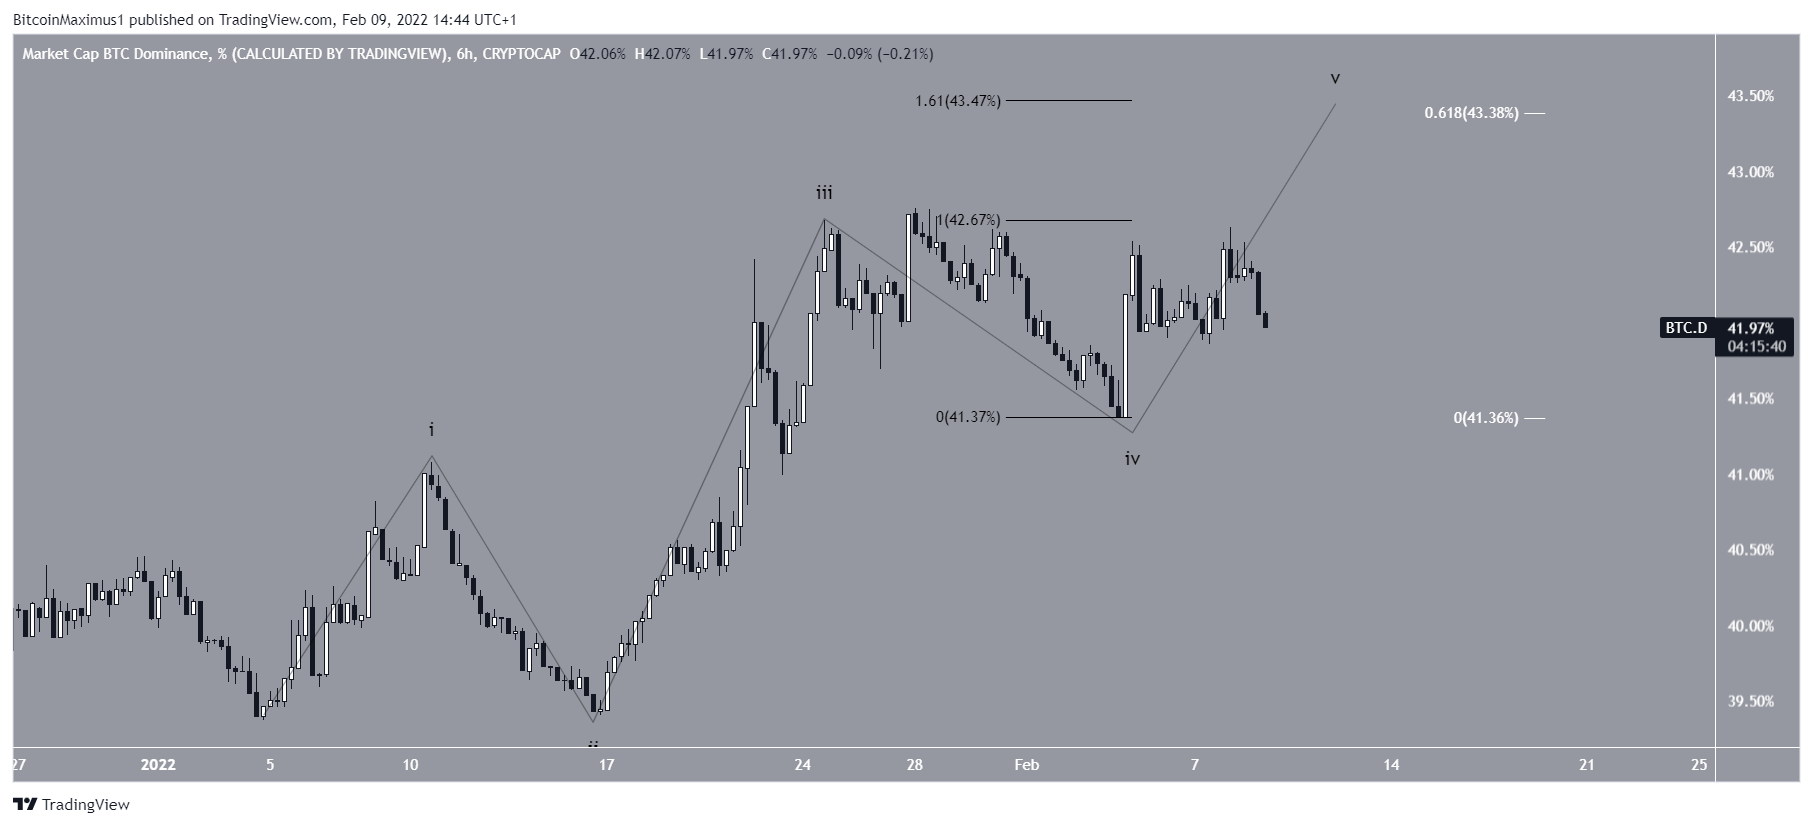
The fact that the increase has taken the shape of a five wave upward movement would suggest that the low is in.
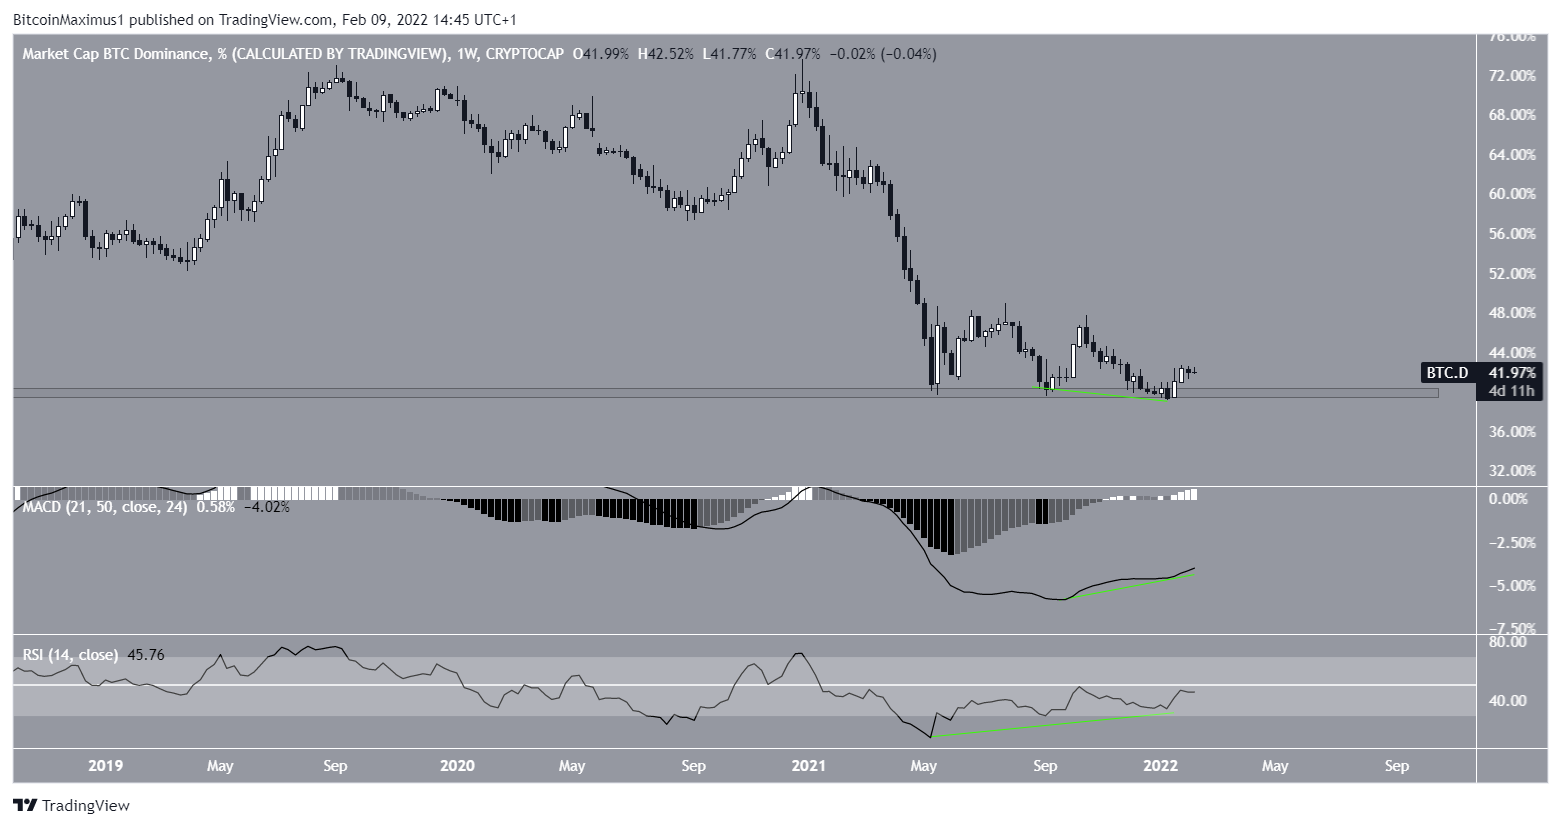
This is supported by readings from the weekly time-frame.
Both the RSI and MACD have generated very significant bullish divergences, an occurrence which is rare in the weekly time-frame.
Therefore, it is possible that the BTCD downward movement that has been ongoing since the beginning of 2021 has come to an end.
For BeInCrypto’s latest Bitcoin (BTC) analysis, click here
The post Long-Term Divergences Cause Significant Bitcoin Dominance Rate (BTCD) Increase appeared first on BeInCrypto.
